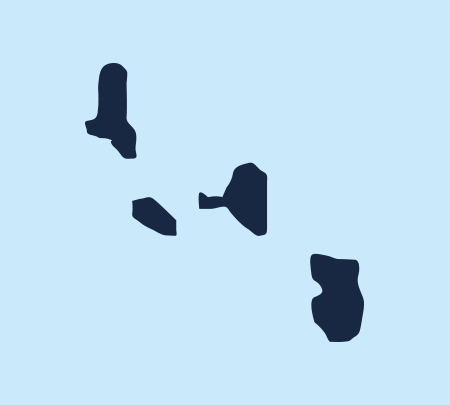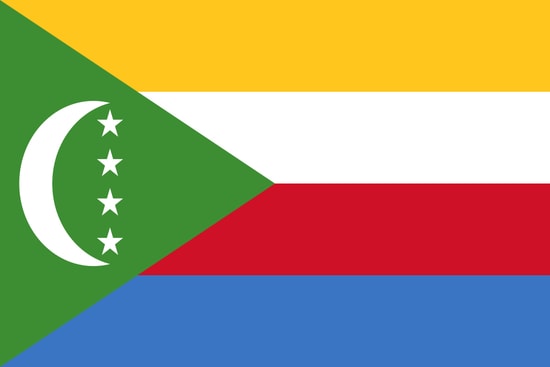

Moroni
Capital city
Moroni
Economic City
832 322
Population
1 861 Km²
Surface area
1 203 080 508
Total GDP (USD)
2.8 %
GDP Growth (annual %)
4.6 %
Inflation, GDP deflator (annual %)
8 607 994
Total FDI (USD)Source: The World Bank
GDP per activity sector

34 %
Agriculture
(%of GDP)

11 %
Industry
(%of GDP)

8 %
Manufacturing
(%of GDP)

55.7 %
Services,value added
(%of GDP)
Source: The World Bank
Foreign Trade Indicators (USD thousand)
101 832
Export of Goods
371 919
Import of Goods
Source: International Trade Center (ITC)
main exports

Coffee, tea, maté and spices
Essential oils and resinoids; perfumery, cosmetic or toilet preparations

Ships, boats and floating structures
main clients

France

Singapore

Netherlands

Germany

Pakistan
Source: International Trade Center (ITC)
main imports

Machinery, mechanical appliances, nuclear reactors, boilers; parts thereof
Other made-up textile articles; sets; worn clothing and worn textile articles; rags
Furniture; bedding, mattresses, mattress supports, cushions and similar stuffed furnishings
main suppliers

France

UAE

Madagascar

China

Pakistan
Source: International Trade Center (ITC)

